Yesterday at the New England Health Datapalooza, held at the DCU Center in Worcester, Mass., judges Pierce Graham-Jones, Innovator in Residence at the US Department of Health and Human Services; John Halamka, CIO of Beth Israel Deaconess Medical Group; and Manu Tandon, CIO of the MA Department of HHS, selected hGraph, an open system for visualizing personal health metrics designed by Involution Studios, as the second place finisher in the regional competition.

Involution Studios Creative Director Juhan Sonin receives the award for hGraph from John Halamka, Pierce Graham-Jones, and Manu Tandon at the New England Health Datapalooza.
Datapalooza entries were judged on use of federal government data, creativity / innovation / originality, patient empowerment / engagement, usefulness to the public, and scalability. The New England Health Datapalooza was organized by the Massachusetts Health Data Consortium. Placing second in the competition qualifies hGraph and Involution to advance to the national Health Datapalooza, held in Washington, DC in June, 2013.
As the transformation from paper to electronic records takes place, hGraph provides an open source software visualization tool to health care providers and patients that enables decision-grade analysis. Like most information heavy fields, healthcare is fraught with the problems caused by too much data with no easy way to sort it all. People need to be able to actively use and benefit from the healthcare data collected about them, while avoiding information overload.
In order to gain insight into the complex, multi-dimensional data sets that represent health metrics, healthcare data requires visual representations that are engaging, optimized for use by both the health care provider and the patient, and support high-level pattern recognition and analysis as well as the ability to see deeper details.
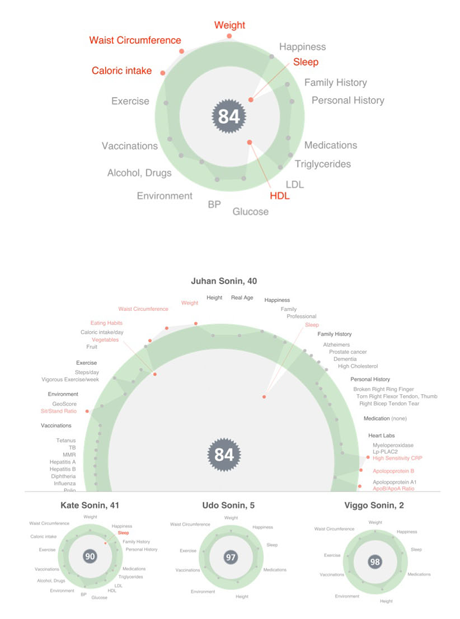
The hGraph information visualization for personal health metrics
hGraph is particularly well-suited for viewing complex data, providing a complete overview of an individual's health. This single picture method can have a profound effect on a person's understanding of their total well-being, because it compiles multiple metrics into a unified graph that can be viewed at a glance.
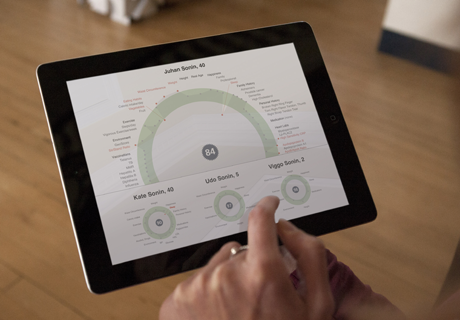
The hGraph information visualization is being incorporated into mobile software, including apps for iPad and iPhone.
hGraph is receiving increased national attention and was selected as a part of the Stanford Medicine X conference last month on the intersection of medicine and emerging technologies. The hGraph information visualization is also being incorporated into mobile software for use on the campuses of two Fortune 500 companies at corporate micro-clinics, beginning this fall. Additionally, hGraph software prototypes are under consideration for use by several major health care providers.
Juhan Sonin, Creative Director of Involution Studios, will be presenting hGraph at O'Reilly's Strata Conference in New York, on October 24, 2012.